Les Misérables Social Network Analysis Using Marimo Notebooks and the NetworkX Python library️⚔️
DATA SCIENCE
Les Misérables Social Network Analysis Using Marimo Notebooks and the NetworkX Python library
Build a Marimo notebook using NetworkX Python library, uncovering the hidden structures in Victor Hugo’s masterpiece

In this post, I walk you through building an interactive Marimo notebook for social network analysis, utilizing the NetworkX Python library and the Les Misérables social network dataset. By implementing social network analysis techniques, we can gain insights into how the connections among the various characters of the novel shape the story, uncovering themes of justice, love, and sacrifice that define the novel’s narrative.
What about Les Misérables?💔
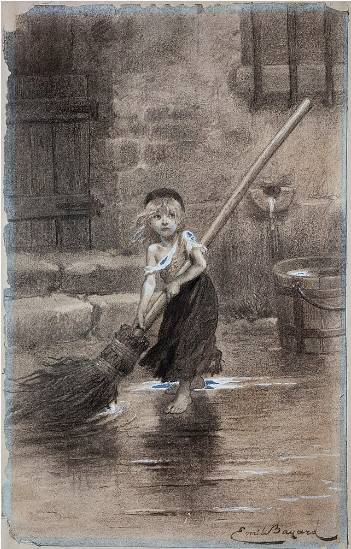
Certainly, Les Misérables is one of the greatest stories ever told. I literally adore every version and variation of it — the book, the movies, the TV series, the musical — all of it.
Written in 1862, Les Misérables explores the concepts of justice, redemption, love, and sacrifice within the societal and cultural framework of 19th-century France. The narrative follows the lives of several different characters, most notably Jean Valjean, an ex-convict seeking redemption, and Inspector Javert, who is determined to arrest him. Through the intertwined fates of Jean Valjean and Javert, we get to dive deep into the struggles of the human spirit and the complexities of ethics and morality, as well as a powerful commentary on various historical events, such as the Battle of Waterloo or the June Rebellion of 1832. Unsurprisingly, as the title of the novel indicates, ultimately the main focus of the story is the predicament of those who are impoverished and marginalized. Several tragic figures such as Fantine — a single mother — , or Gavroche — a street boy — , remind us that life is, in fact, unjust and unfair.
🍨DataCream is a newsletter offering data-driven articles and perspectives on data, tech, AI, and ML. If you are interested in these topics subscribe here.
An interesting, but not so well -nown, fact about Les Misérables is that before being published in a single volume in 1862, parts of the novel were published in series format in the magazine Le Journal des débats from 1860 to 1862. More precisely, Hugo originally wrote the entire novel in serialized format and planned to publish it issue by issue in some magazine, but ultimately changed his mind. The practice of serializing novels was quite popular in the 19th century, allowing authors to reach a wider audience and build anticipation for the complete story, much like today’s soap operas containing dozens of episodes, storylines, and characters. Likewise, Les Misérables includes dozens of interrelated characters and plotlines.
Given the large number of characters in Les Misérables and their rather complex relationships, performing a social network analysis of the novel seems like an interesting idea to further explore.
What about Social Network Analysis?🔗
Social Network Analysis (SNA) is a methodological approach used to study the relationships and structures that occur within a social network, utilizing networks and graph theory. A core concept of SNA is that various individuals that are included in a social group , are referred to as nodes, and the relationships among them are referred to as edges. This framework allows us to visualize and analyze how individuals interact within a social network, providing insights into its dynamics.
In particular, some basic SNA concepts that I will utilize throughout this post are the following:
- Nodes: A node represents an individual within a social network, as for instance a character in a novel.
- Edges: An edge represents the relationship between two nodes within a social network.

- Degree Centrality: A measure for the number of direct connections of a node within the network. A node with high degree centrality is considered influential because it interacts with many other nodes.
- Betweenness Centrality: A measure for how often a node acts as a bridge along the shortest path between two other nodes. Nodes with high betweenness centrality can control the flow of information and resources within the network.
- Closeness Centrality: A measure for how close a node is to all other nodes in the network. Nodes that are centrally located can quickly interact with others, making them critical for circulating information.

- Network Density: This represents the proportion of actual connections to the possible connections. A denser network indicates a greater level of interconnectedness among nodes, whereas a sparse network indicates that nodes are only loosely connected.
- Communities: Communities represent groups of nodes that are more densely connected to each other than to the rest of the network. In this way communities stand for subgroups within the initial network.
- Network Diameter: This represents the longest shortest path between any two nodes in a graph. In other words, network diameter is the maximum distance needed to travel across the network.
By exploring those metrics on the Les Misérables social network, we can gain insights on how the relationships among characters contribute to the novel’s themes and plot development.
What about Marimo notebooks?📊
Usually, I use Jupyter Lab notebooks for my Medium code tutorials, but lately I’ve stumbled upon Marimo notebooks. Marimo plays out well with Plotly library (which I love to use for visualizations), so I decided to give it a try for this post. Marimo is an open-source reactive notebook for Python. Unlike traditional Python notebooks, it is reproducible, git-friendly, executable as a script, and shareable as an app.
More specifically, in a Marimo notebook, each cell reacts to code changes throughout the entire notebook, making updates automatically cascade through all relevant cells. This feature improves workflow efficiency by reducing the need to rerun multiple cells after making an adjustment. On top of this, it allows to share your notebooks as interactive apps.
It is important to note that Marimo has some differences from similar Python notebooks. For instance, we cannot redefine the same variable names in different cells — instead, we have to use _ in the beginning of variable names, flagging them as variables local to the current cell.
Another significant difference in regards to Plotly visualizations is that fig.show()won’t display our chart within the notebook, but rather on a separate browser tab. Instead, if we want to display the chart within the Marimo notebook, what we need to do is the following: locally define the Plotly chart _plot , then use plot = mo.ui.plotly(_plot), and then finally on a new cell use mo.hs.stack(plot). This may sound like extra work, but it allows the plots to be rendered and updated independently of their scripts.
Do you hear the people sing?🕊️
So, in this tutorial:
- Firstly, we are going to set up our Marimo notebook and install all the required Python libraries …
- … then, import the Les Misérables network data …
- … and finally, explore the relationships and connections in Les Misérables social network, by checking the centrality measures, communities, density and many more.
Let’s go! 💣
Setting up the environment
Since I will be using a Marimo notebook throughout the entire analysis, naturally my first task would be to make sure that Marimo is installed. I will also be using Plotly for the visualizations and communities library for for detecting community structures within the social network graph. We can easily install all these by:
pip install marimo plotly communities
Next, we can create and launch a new blank Marimo notebook named ‘les_miserables_sna.py’ by:
marimo edit les_miserables_sna.py
… and then our newly created blank notebook is going to open in our browser..

Getting the data together
The NetworkX library directly provides the network graph for Les Misérables — we can easily load it by using the les_miserables_graph()built-in function. In this way, we can load the Les Misérables network data in our Marimo notebook:
import marimo as mo
import networkx as nx
import plotly.graph_objects as go

# Load the Les Miserables graph
les_mis_graph = nx.les_miserables_graph()

# Get node positions using a layout algorithm
# here I use spring layout
pos = nx.spring_layout(les_mis_graph)

# Extract node positions
x_nodes = [pos[node][0] for node in les_mis_graph.nodes()]
y_nodes = [pos[node][1] for node in les_mis_graph.nodes()]
Then, we can create the Plotly visualization of the network:
# Create edge traces for Plotly
edge_x = []
edge_y = []
for edge in les_mis_graph.edges():
    x0, y0 = pos[edge[0]]
    x1, y1 = pos[edge[1]]
    edge_x += [x0, x1, None]
    edge_y += [y0, y1, None]

edge_trace = go.Scatter(
    x=edge_x, y=edge_y,
    line=dict(width=0.5, color='#888'),
    hoverinfo='none',
    mode='lines')

# Create node trace for Plotly
node_trace = go.Scatter(
    x=x_nodes, y=y_nodes,
    mode='markers+text',
    marker=dict(
        size=10,
        color='skyblue',
        line=dict(width=2)
    ),
    text=list(les_mis_graph.nodes()),
    textposition="top center",
    hoverinfo="text"
)

# Create the figure and layout
_plot = go.Figure(data=[edge_trace, node_trace],
                layout=go.Layout(
                    title="Les Misérables Character Network",
                    showlegend=False,
                    hovermode='closest',
                    margin=dict(b=0, l=0, r=0, t=40),
                    xaxis=dict(showgrid=False, zeroline=False, showticklabels=False),
                    yaxis=dict(showgrid=False, zeroline=False, showticklabels=False),
                    width = 1100
                ))

plot = mo.ui.plotly(_plot)
Notice how I use _plotas the Plotly chart name with the_indicating local variables in Marimo notebooks. On top of this, plot = mo.ui.plotly(plot) sets up the plot to be displayed within the Marimo notebook, and not pop up in a new browser. Then, to finally display the chart within the notebook, we need use in a new cell:
mo.hstack([plot, plot.value])
and ✨Voilà✨ — we have our interactive Plotly chart!
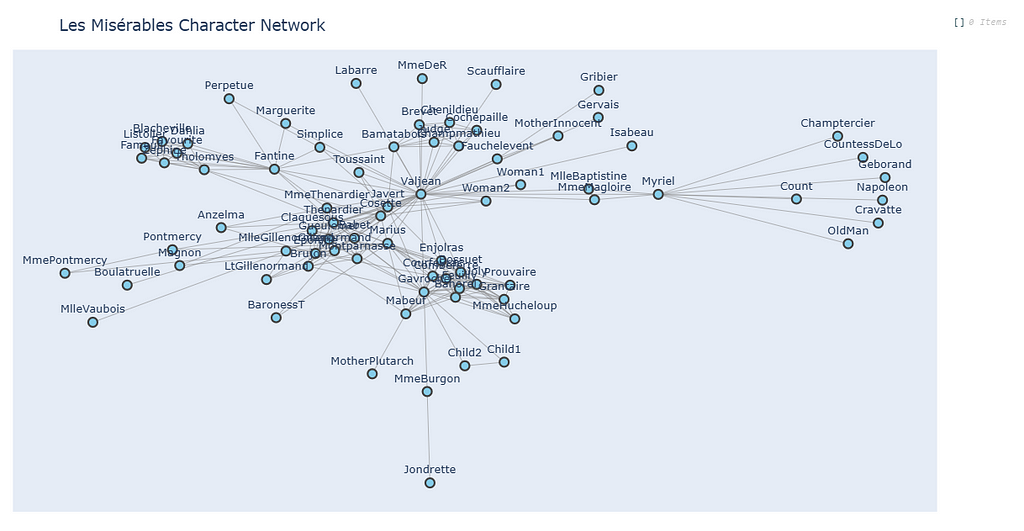
What is worth highlighting here about Marimo, is that the notebook is fully responsive. That is, whenever we change something in the cell where plotis defined and run it, any other related cell is directly updated with no need to run it again.
Now that we have loaded the graph into our notebook, we can further proceed to the analysis, exploring the characters of Les Misérables and their relationships.
Centrality Measures
To begin with, we can easily calculate the centrality measures of the graph. That is, the Degree Centrality, Betweenness Centrality, and Closeness Centrality, which can be calculated using the built-in functions of the NetworkX library nx.degree_centrality(), nx.betweenness_centrality(), nx.closeness_centrality respectively.
# Degree Centrality
degree_centrality = nx.degree_centrality(les_mis_graph)
top_5_degree = sorted(degree_centrality.items(), key=lambda x: x[1], reverse=True)[:5]
print("Top 5 Characters by Degree Centrality:")
for character, centrality in top_5_degree:
    print(f"{character}: {centrality:.2f}")

# Betweenness Centrality
betweenness_centrality = nx.betweenness_centrality(les_mis_graph, normalized=True)
top_5_betweenness = sorted(betweenness_centrality.items(), key=lambda x: x[1], reverse=True)[:5]
print("\nTop 5 Characters by Betweenness Centrality:")
for character, centrality in top_5_betweenness:
    print(f"{character}: {centrality:.2f}")

# Closeness Centrality
closeness_centrality = nx.closeness_centrality(les_mis_graph)
top_5_closeness = sorted(closeness_centrality.items(), key=lambda x: x[1], reverse=True)[:5]
print("\nTop 5 Characters by Closeness Centrality:")
for character, centrality in top_5_closeness:
    print(f"{character}: {centrality:.2f}")
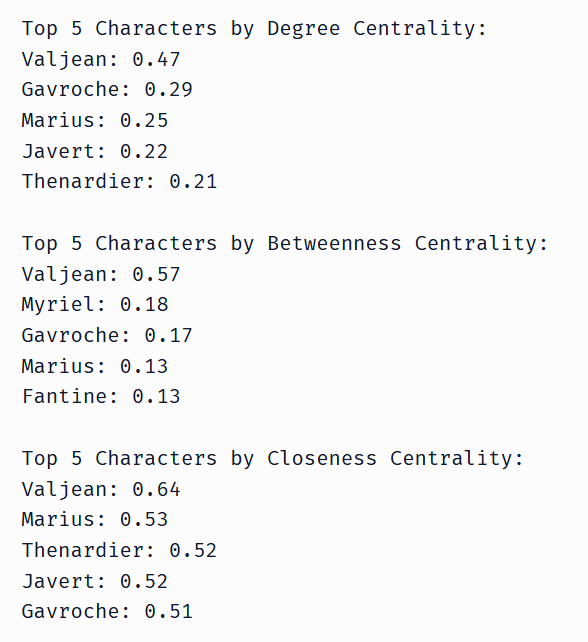
These centrality measures reveal some interesting insights into the social network structure of Les Misérables. Overall, Jean Valjean has by far the highest score in all three measures — Degree Centrality, Betweenness Centrality, and Closeness Centrality — emerging as the undeniable protagonist and main character of the novel. Characters like Gavroche, Javert, and Marius also have notably high scores, indicating their involvement with various characters throughout the story and connecting otherwise separate parts of the network.
In addition, we can concentrate all three centrality measures and display them into a single dataframe:
import pandas as pd
centrality_df = pd.DataFrame({
        "Character": list(degree_centrality.keys()),
        "Degree Centrality": list(degree_centrality.values()),
        "Betweenness Centrality": [betweenness_centrality[node] for node in degree_centrality.keys()],
        "Closeness Centrality": [closeness_centrality[node] for node in degree_centrality.keys()]
})

Marimo conveniently allows for an interactive visualization of the dataframe, enabling us to do basic table actions on the spot, such as sorting, filtering or freezing columns.
Netowrk Density and Diameter
Moving forward, we can easily calculate the network density by:
# Network Density
graph_density = nx.density(les_mis_graph)
print(f"Graph Density: {graph_density:.4f}")

On top of this, we can also calculate the network diameter by:
# Graph Diameter
# Note: Diameter can only be calculated for connected components, so we find the largest connected component
if nx.is_connected(les_mis_graph):
    graph_diameter = nx.diameter(les_mis_graph)
    print(f"Graph Diameter: {graph_diameter}")
else:
    # If the graph is not connected, find the diameter of the largest connected component
    largest_cc = max(nx.connected_components(les_mis_graph), key=len)
    subgraph = les_mis_graph.subgraph(largest_cc)
    graph_diameter = nx.diameter(subgraph)
    print(f"Graph Diameter (Largest Connected Component): {graph_diameter}")

Network density of 0.0868 indicates that the Les Misérables network is relatively sparse, with only 8.68% of the possible connections actually happening. In other words, most of the characters of the novel are not directly connected to each other. This is in line with the distinct, loosely connected groups and storylines within the narrative. On the flip side, a network diameter equal to 5 reveals that even in this sparse network, the longest shortest path between any two characters is only five steps. This, helps to form a small-world network, where characters are separated by only a few intermediaries, ultimately ensuring the coherence and forward movement of the narrative.
Communities
Next, it is interesting to explore what communities are formed within the social network. To identify the communities, I will be using the communities Python library, and more specifically, the Louvain method.
# Community Detection with the Louvain Method
from community import community_louvain

# Compute the best partition for Louvain method
partition = community_louvain.best_partition(les_mis_graph)

# Organize communities by nodes
communities = {}
for node, community_id in partition.items():
    if community_id not in communities:
        communities[community_id] = []
    communities[community_id].append(node)

# Optional: Display communities in a DataFrame for easier viewing
community_df = pd.DataFrame({
    "Community": [f"Community {community_id + 1}" for community_id in communities.keys()],
    "Members": [", ".join(members) for members in communities.values()]
})

community_df

We can also visually represent the communities with different node colors in the network graph:
import random

_colors = ['blue', 'red', 'green', 'orange', 'pink', 'yellow', 'purple', 'cyan', 'magenta', 'brown']
_num_communities = len(communities)

# Ensure enough colors for all communities by repeating the list if needed
if _num_communities > len(_colors):
    _colors = _colors * (_num_communities // len(_colors) + 1)

# Create node traces for each community with distinct colors
_node_traces = []
for _i, (_community_id, _nodes) in enumerate(communities.items()):
    _x_nodes = [pos[_node][0] for _node in _nodes]
    _y_nodes = [pos[_node][1] for _node in _nodes]
    _node_trace = go.Scatter(
        x=_x_nodes, y=_y_nodes,
        mode='markers+text',
        marker=dict(
            size=10,
            color=_colors[_i],  # Use a distinct color for each community
            line=dict(width=2)
        ),
        text=_nodes,
        textposition="top center",
        hoverinfo="text"
    )
    _node_traces.append(_node_trace)

# Create the figure and layout
_plot_2 = go.Figure(data=[edge_trace] + _node_traces,
                     layout=go.Layout(
                         title="Les Misérables Character Network by Community",
                         showlegend=False,
                         hovermode='closest',
                         margin=dict(b=0, l=0, r=0, t=40),
                         xaxis=dict(showgrid=False, zeroline=False, showticklabels=False),
                         yaxis=dict(showgrid=False, zeroline=False, showticklabels=False),
                         width=1000
                     ))

plot_2 = mo.ui.plotly(_plot_2)
… and finally render the chart by:
mo.hstack([plot_2, plot_2.value])
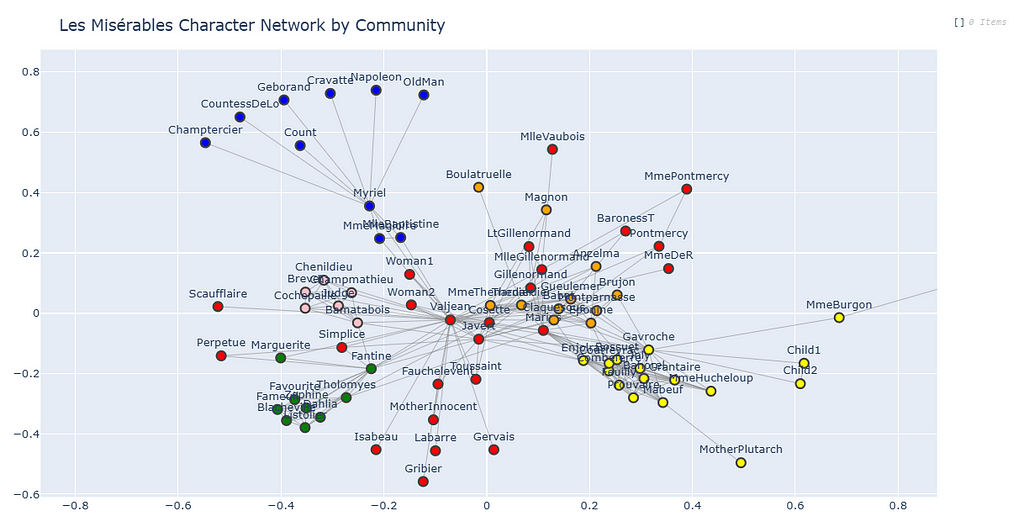
In the resulting illustration, we can clearly identify the various communities and storylines of the novel. For instance, the Revolutionaries are depicted with yellow, including characters like Enjolras, Gavroche, and other students involved in the June Rebellion. Some other examples would be Fantine and relative characters from her origin storyline illustrated with green, or Valjean’s associates and benefactors, like Bishop Myriel and Cosette depicted with blue.
Jean Valjean & Javert: Ego Network Analysis
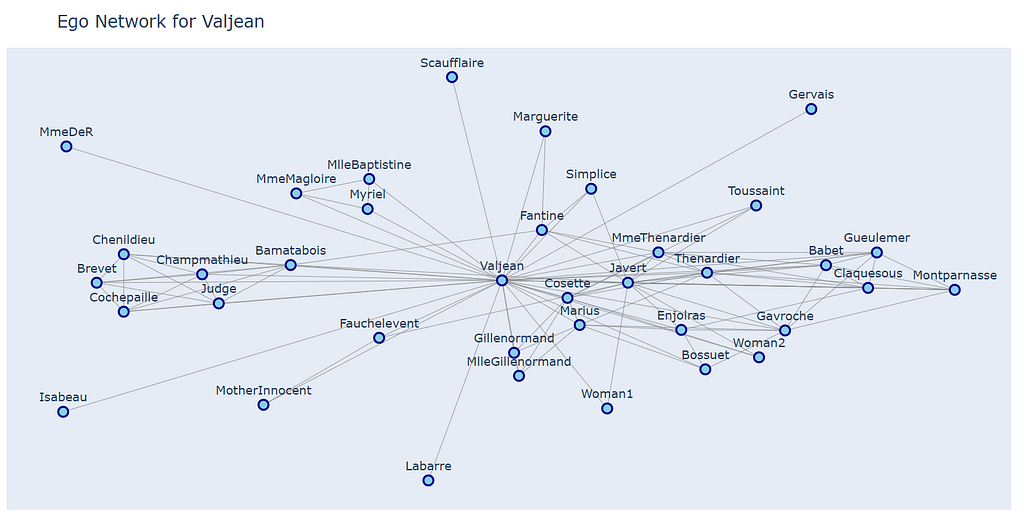
Finally, I carried out an ego network analysis for the ultimate main character of the novel and his eternal rival: Jean Valjean and Javert. The ego network of a character refers to their immediate connections, as well as any connections among those immediate connections. Analyzing the ego network of key characters like Jean Valjean and Javert, helps reveal their influence within their local social circles.
We can do this by creating a function for calculating and visualizing the ego network of a character:
def visualize_ego_network(graph, character):

    # Extract the ego network for the character
    ego_graph = nx.ego_graph(graph, character)

    # Calculate the size of the ego network (number of nodes and edges)
    num_nodes = ego_graph.number_of_nodes()
    num_edges = ego_graph.number_of_edges()
    print(f"\nEgo Network for {character}:")
    print(f"Number of Nodes: {num_nodes}")
    print(f"Number of Edges: {num_edges}")

    # Get positions for nodes in the ego network
    _pos = nx.spring_layout(ego_graph, seed=42)

    # Create edge traces for Plotly
    _edge_x = []
    _edge_y = []
    for _edge in ego_graph.edges():
        _x0, _y0 = _pos[_edge[0]]
        _x1, _y1 = _pos[_edge[1]]
        _edge_x += [_x0, _x1, None]
        _edge_y += [_y0, _y1, None]

    _edge_trace = go.Scatter(
        x=_edge_x, y=_edge_y,
        line=dict(width=0.5, color='#888'),
        hoverinfo='none',
        mode='lines'
    )

    # Create node trace for Plotly
    _node_x = []
    _node_y = []
    _node_text = []
    for _node in ego_graph.nodes():
        _x, _y = _pos[_node]
        _node_x.append(_x)
        _node_y.append(_y)
        _node_text.append(_node)  # Node label (character name)

    _node_trace = go.Scatter(
        x=_node_x, y=_node_y,
        mode='markers+text',
        marker=dict(
            size=10,
            color='skyblue',
            line=dict(width=2, color='darkblue')
        ),
        text=_node_text,
        textposition="top center",
        hoverinfo="text"
    )

    # Create the figure
    _plot = go.Figure(data=[_edge_trace, _node_trace],
                        layout=go.Layout(
                            title=f"Ego Network for {character}",
                            showlegend=False,
                            hovermode='closest',
                            margin=dict(b=0, l=0, r=0, t=40),
                            xaxis=dict(showgrid=False, zeroline=False, showticklabels=False),
                            yaxis=dict(showgrid=False, zeroline=False, showticklabels=False),
                            width=1000, height=600
                        ))
    mo.ui.plotly(_plot)
    return _plot
Thus, we can then create the ego network of Valjean:
plot_3 = visualize_ego_network(les_mis_graph, 'Valjean')
mo.hstack([plot_3])
… and also for Javert:
plot_3 = visualize_ego_network(les_mis_graph, 'Javert')

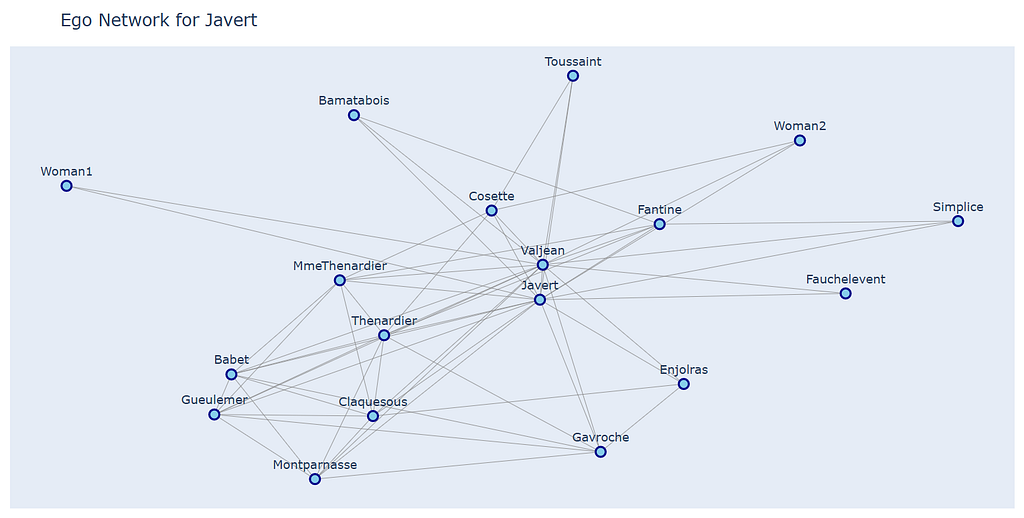
We immediately notice that Valjean has an extensive network, which comes as no surprise since he is the protagonist of the novel and the main link between the various storylines. Valjean interacts both with allies and adversaries, having central and integrative role in the novel. On the flip side, Javert has a smaller ego network, which includes only characters that are either associated with law enforcement or have some kind of conflict with him, like Valjean, Enjoiras or Gavroche. His ego network effectively illustrates his isolation and obsession with pursuing Vanjean — notice how central is Vanjean on the ego network of Javert.
On my mind 🌟
Analyzing the social network graph of Les Misérables allows to explore the novel’s complex characters and interconnections following a more quantitative and objective approach. To me, it is really interesting how certain impressions we get when reading the novel are reconfirmed by the analysis — for instance Jean Valjean’s central role in the storyline is illustrated clearly by the calculated centrality measures. Another example would be the Louvain method successfully identifying the various character groups and storylines of the novel, like the Revolutionaries or characters from Fantine’s origin story.
Moreover, I think it is fascinating how Hugo constructs a small-world network, that closely resembles social structures of real life. In particular, as indicated by the identified communities, characters are part of tightly connected, specific groups, rather than being interconnected with everyone in the social network. Such examples of tight groups might be the Revolutionaries, or Valjean’s associates. Characters like Valjean, Javert or Marius, who connect various groups and storylines, effectively resemble social influencers of real life. Finally, five degrees of separation between any two characters (that is, network diameter = 5), despite the relatively low network density, effectively resembles six degrees of separation of real social networks.
Overall, social network analysis not only enhances our understanding of individual character arcs, but also sheds light on the collective dynamics that define the novel’s complex narrative. Ultimately, the novel feels so relatable, timeless and real, largely because the structure of the relationships among the characters closely resembles a real social network.
Attribution
This analysis uses the Les Misérables dataset provided by the NetworkX library, which is distributed under a BSD license permitting commercial use. The dataset was originally derived from Donald Knuth’s The Stanford GraphBase.
✨Thank you for reading!✨
Loved this post?
💌 Join me on Substack or LinkedIn ☕, or Buy me a coffee!
or, take a look at my other data science posts:
- From Data to Dashboard: Visualizing the Ancient Maritime Silk Road with Dash Leaflet and SeaRoute…
- Was Michael Scott the World’s Best Boss?
Les Misérables Social Network Analysis Using Marimo Notebooks and the NetworkX Python library🕊️⚔️ was originally published in Towards Data Science on Medium, where people are continuing the conversation by highlighting and responding to this story.
from Datascience in Towards Data Science on Medium https://ift.tt/ITjhZ8J
via IFTTT


