Addressing Missing Data
Understand missing data patterns (MCAR, MNAR, MAR) for better model performance with Missingno
In an ideal world, we would like to work with datasets that are clean, complete and accurate. However, real-world data rarely meets our expectation. We often encounter datasets with noise, inconsistencies, outliers and missingness, which requires careful handling to get effective results. Especially, missing data is an unavoidable challenge, and how we address it has a significant impact on the output of our predictive models or analysis.
Why?
The reason is hidden in the definition. Missing data are the unobserved values that would be meaningful for analysis if observed.

In the literature, we can find several methods to address missing data, but according to the nature of the missingness, choosing the right technique is highly critical. Simple methods such as dropping rows with missing values can cause biases or the loss of important insights. Imputing wrong values can also result in distortions that influence the final results. Thus, it is essential to understand the nature of missingness in the data before deciding on the correction action.
The nature of missingness can simply be classified into three:
- Missing Completely at Random (MCAR) where the missingness do not has a relationship to the missing data itself.
- Missing at Random (MAR) where the missingness is related to observed data but not to the missing data itself.
- Missing Not at Random (MNAR) where the missingness is related to the unobserved data. That is why it is more complex to address.
These terms and definitions initially seem confusing, but hopefully they will become clearer after reading this article. In the upcoming sections, there are explanations about different types of missingness with some examples, also analysis and visualization of the data using the missingno library.
To show the different missingness types, National Health and Nutrition Examination Survey (NHANES) data between August 2021 — August 2023 for Diabetes is used in this article [1]. It is an open source data which is available and can be downloaded through this link.
The survey data can be downloaded as .xpt file. We can convert it into a pandas DataFrame to work on:
import pandas as pd
# Path to the XPT file
file_path = 'DIQ_L.xpt'
# Read the XPT file into a DataFrame
df = pd.read_sas(file_path, format='xport', encoding='utf-8')
In this dataset, SEQN shows the respondents’ sequence number. All the other columns corresponds to a question in the survey. Short descriptions of each question are as follows:
- DIQ010: Doctor told you have diabetes?
- DID040: Age when first told you had diabetes?
- DIQ160: Ever told you have prediabetes?
- DIQ180: Had blood tested past three years?
- DIQ050: Are you now taking insulin?
- DID060: How long taking insulin?
- DIQ060U: Unit of measure
- DIQ070: Take diabetic pills to lower blood sugar?
If you would like to read more about the questions and answer options in the survey, you can read from this link.
Exploring Missing Values
In order to understand the nature of the missing values, we should understand the patterns and distribution of the missing data.
Let’s firstly discuss how we can basically see whether our data has missing and/or null values.
# Display the first few rows of df
df.head()

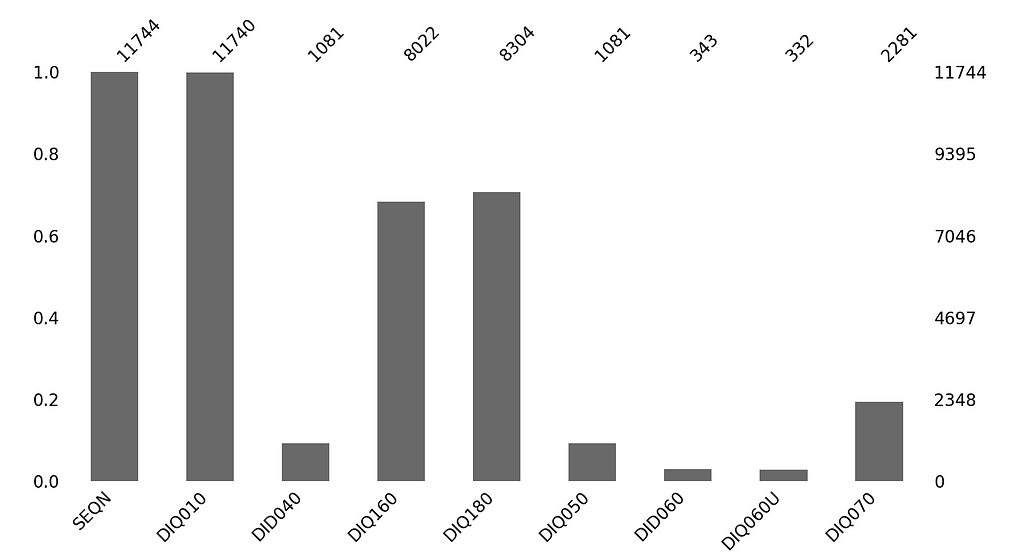
For this case, we can see even from the first rows, there are many null values in the data. The code below could be used to see there are how many missing values in each variable.
#shows how many null values in each column
df.isna().sum()
# Missingno bar chart
msno.bar(df, figsize=(4,4))
Now, more significant question is:
🧠 What we can do to understand the nature of the missingness?
Creating a heatmap using a missingness map and the original data could be helpful for the first look.
def create_missingness_map(mis_data):
    columns=mis_data.columns
    print(columns)
    mis_map=pd.DataFrame(data=np.zeros(mis_data.shape), columns=mis_data.columns, dtype=int)
    for col in columns:
        col_mis_index=mis_data[mis_data[col].isnull()].index
        mis_map.loc[col_mis_index,col]=1
    return mis_map

mis_map = create_missingness_map(df)
mis_map
# Compute correlations between missingness and original data
correlation_matrix = pd.DataFrame(index=mis_map.columns, columns=df.columns)
for mis_col in mis_map.columns:
    for col in df.columns:
        if mis_col != col:
            # Compute Spearman correlation (ignoring NaNs)
            correlation = mis_map[mis_col].corr(df[col].apply(lambda x: np.nan if pd.isnull(x) else x), method='spearman')
            correlation_matrix.loc[mis_col, col] = correlation

correlation_matrix = correlation_matrix.astype(float)

# Plot the heatmap
plt.figure(figsize=(10, 8))
sns.heatmap(correlation_matrix, annot=True, fmt=".2f", cmap="coolwarm", cbar=True)
plt.title("Correlation Heatmap: Missingness Patterns")
plt.xlabel("Original Data Columns")
plt.ylabel("Missingness Indicators")
plt.tight_layout()
plt.show()
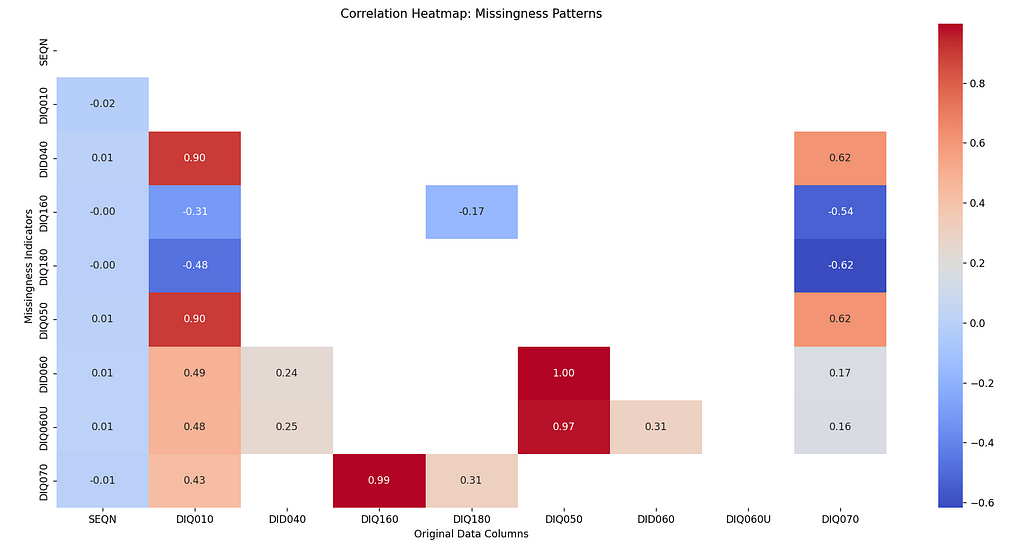
In this heatmap, the red shades indicate that the missingness of the column is positively correlated on the value of the corresponding column, which indicates that the missingness is not at random. We can see there is a correlation between the missingness of DID060, DIQ060U, DIQ050 variables.
Dark blues show the negative correlation which means the presence of the data decreases the likelihood of missingness in the corresponding columns, like we see between DIQ070 and DIQ180. The white or gray shades indicate no dependency.
Let’s discuss more on the nature of the missingness.
Missing Completely at Random (MCAR)
Missingness of data points are completely independent of the value of any variable in the dataset including itself.
🤔 What is that even mean?
It means that we shouldn’t see;
- A certain value of a variable is always missing by looking at its distribution.
- The units of a variable is always missing when another variable has a certain value.
- Two or more variables always be missing or observed together.
🤨 How can we know whether our missingness type is MCAR?
- Apply t-test for differences in means of other variables for those having missing data and those having observed data
- Apply chi-squared test to check frequencies of the values
We can visually interpret whether the missingness of variable is dependent on any other variable or completely at random using missingno matrix. Let’s look for the missingness of question DIQ160 (i.e. Ever told you have prediabetes?):
df.sort_values(by=['DIQ160'], inplace = True)
msno.matrix(df, figsize=(4,4))
plt.show()
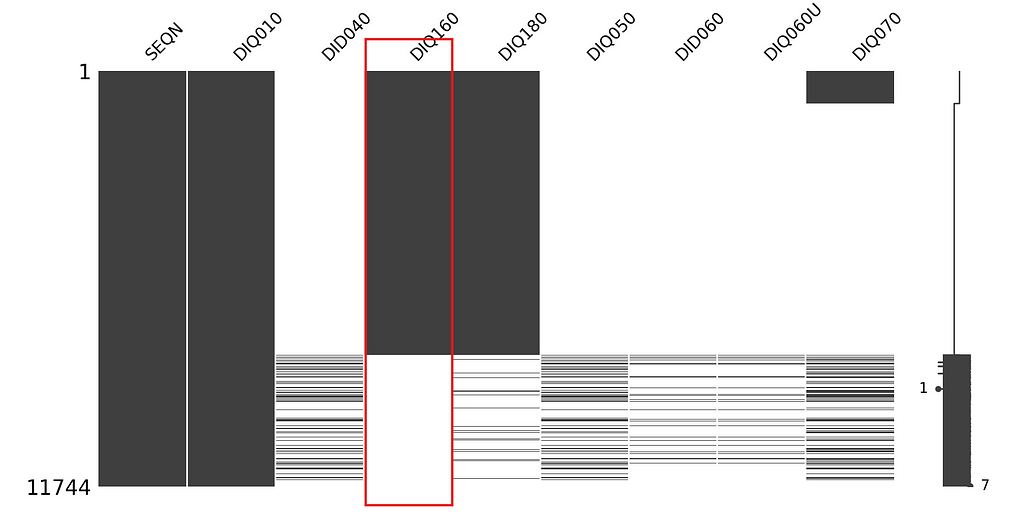
From the graph it looks like the missingness of DIQ160 is completely at random. However, we should test it to be sure. We can use the missingness map we previously created, then apply chi-square test and calculate the p-value to accept or reject the hypothesis: “Missingness of DIQ160 is independent of other variables.”
from scipy.stats import chi2_contingency

# List of columns for which to test missingness against DIQ160
columns_to_test = ["DIQ010", "DID040", "DIQ180", "DIQ050", "DID060", "DIQ060U", "DIQ070"]

# Loop through each column and run the chi-squared test
for column in columns_to_test:
    # Create a crosstab between DIQ160 and the missingness of the current column
    tab1 = pd.crosstab(df["DIQ160"], mis_map[column])

    # Perform the chi-squared test
    chi2, p, dof, ex = chi2_contingency(tab1)

    # Print results
    print(f"\nTesting column: {column}")
    print("p-value: {:.4f}".format(p))
    if p < 0.05:
        print(f"Reject null hypothesis >> Missingness of DIQ160 is not independent of {column}")
    else:
        print(f"Fail to reject null hypothesis >> Missingness of DIQ160 is independent of {column}")
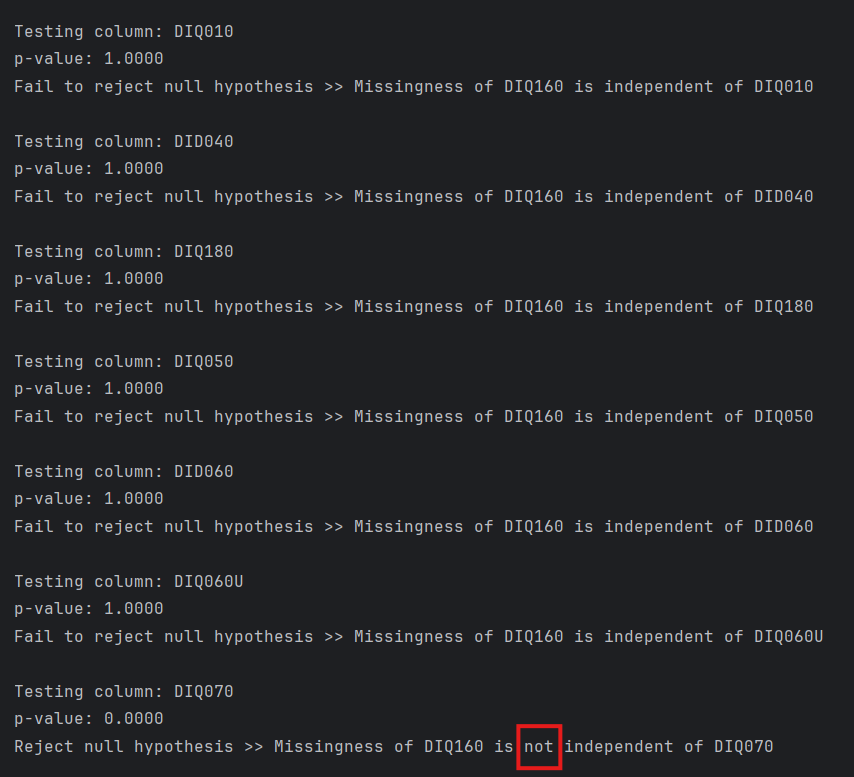
As you see although it is not easy to understand from the visualization, there is a dependency between the missingness of DIQ160 and value of DIQ070 variables. If this wasn’t the case we could conclude as the missingness of DIQ160 is MCAR.
Missing at Random (MAR)
Missingness of a variable depends on the value of any other variable but not on the value of the missing variable itself. The definition initially could be a bit confusing because we are saying it is “at random” although it is not actually at random, but related to other variables.
🤔 What is that mean?
It again means that we shouldn’t see a certain value of a variable is always missing by looking at its own distribution. However this time;
- The units of a variable could always be missing when another variable has a certain value,
Or
- Two or more variables can be missing or observed together.
In our diabetes survey data, we can guess that the missingness of variable DIQ060U (i.e. how long have you been taking insulin?) is dependent on variable DID060 (i.e. unit of measure -months, years-), because if the respondent is not taking insulin then they probably did not give a duration to that.
We can draw msno matrix to visually examine this guess.
df.sort_values(by=['DIQ060U'], inplace = True)
msno.matrix(df, figsize=(4,4))
plt.show()

#or vice versa

df.sort_values(by=['DID060'], inplace = True)
msno.matrix(df, figsize=(4,4))
plt.show()
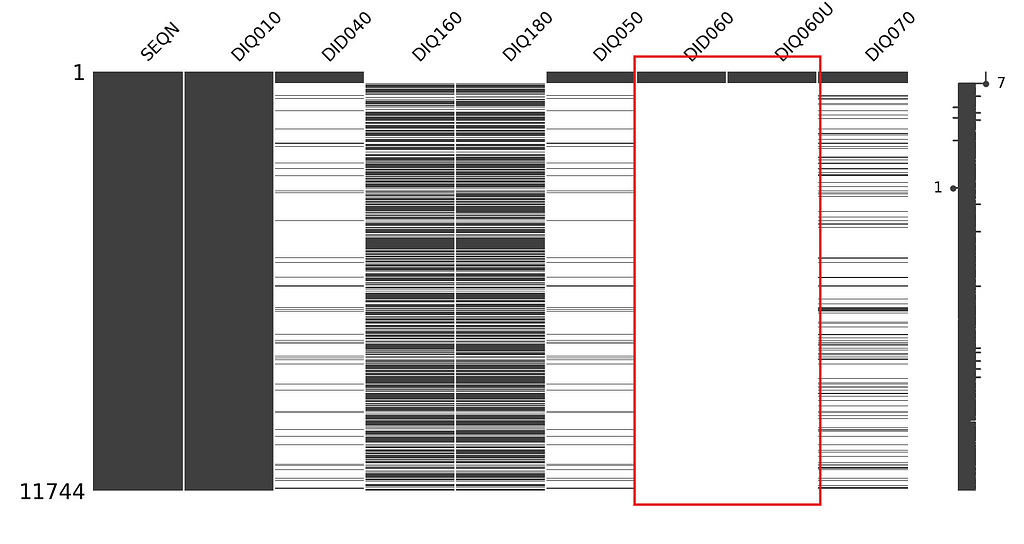
As it can obviously be seen in the matrix graph, when the answer to DIQ060U missing, DID060 is also missing. The missingness of this variable is dependent on another variable’s missingness.
How about the missingness of the DID040 variable (i.e Age when first told you had diabetes?), which could be both MCAR or MAR.
df.sort_values(by=['DID040'], inplace = True)
msno.matrix(df, figsize=(4,4))
plt.show()
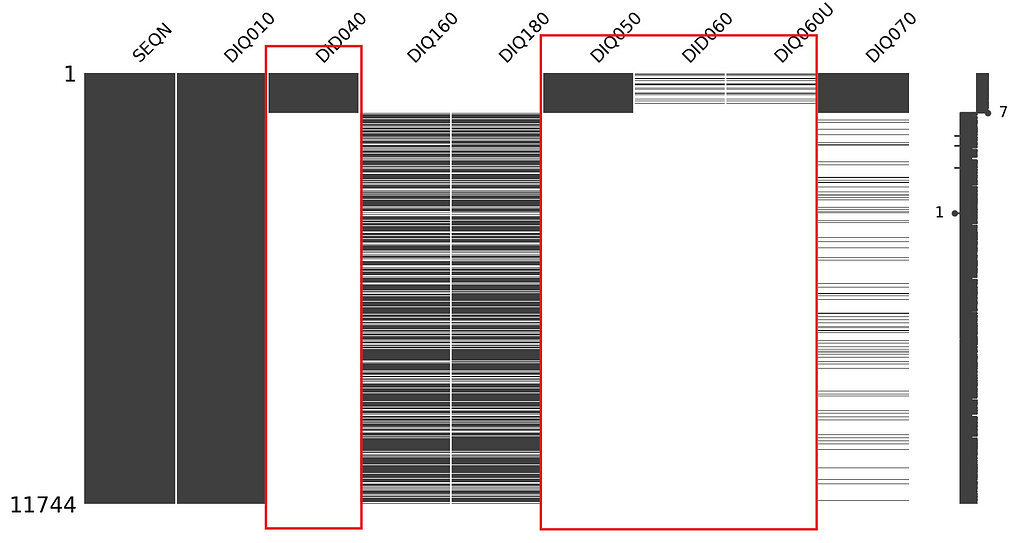
Again, the graph clearly shows us that the missingness of DID040 is correlated with the missingness of other variables, so we can conclude that the missingness type is MAR.
Missing not at Random (MNAR)
Missingness of the variable depends on itself. In this situation the missingness cannot be ignored during modeling process. Each case should be analyzed carefully.
The difficulty is understanding the MNAR at first place. Generally, it is hard to notice that something is missing if you are not an expert on the domain. Therefore, it is highly important to analyze the data with an expert before starting modeling process.
We are generally tend to jump into the modelling before spending more time on preprocessing. However, it is worth to remember the way we handle missing data could break our model’s performance.
In this article, we discussed the ways to understand the nature of the missing data using the visualizations of missingno library and hypothesis tests. After identifying the missingness nature, we can choose appropriate strategies to adress them. In my next article, I will provide more information on what these strategies are. We will discuss more on different imputation techniques. Please stay tuned!
[1] National Health and Nutrition Examination Survey (NHANES) data (August 2021 — August 2023), wwwn.cdc.gov
Addressing Missing Data was originally published in Towards Data Science on Medium, where people are continuing the conversation by highlighting and responding to this story.
from Datascience in Towards Data Science on Medium https://ift.tt/alSQwf3
via IFTTT


